¶ Where to find it
You can find it in the demand prediction section.

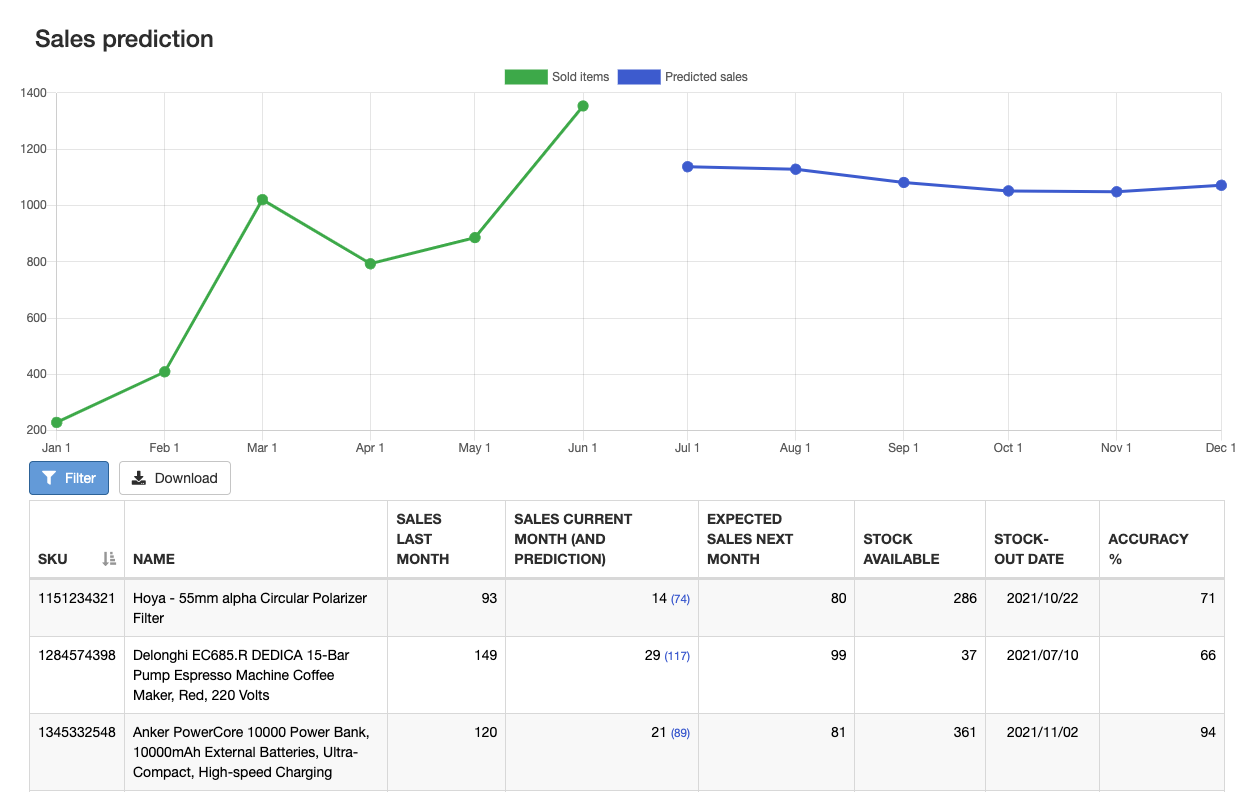
¶ Keep track of your stock and sales
The chart displays the sold items to date (in green) and the sales forecast for the following months (in blue).
The table columns display the following information:
- Sales last month: Sales of the product in the past natural month
- Sales current month (and prediction): Sales for the current natural month. In parentheses, the total predicted sales.
- Expected sales next month: The predicted sales for the following natural month
- Stock available: Current stock
- Stock-out date: The date when the stock will drop to zero, according to the current speed of sales and the forecasts
- Accuracy %: The average accuracy of the forecast for the past months.
|
This feature is available for users of |
|
|
❌ |
Competitor Monitoring |
|
❌ |
AI Pricing |
|
✅ |
Sales Forecast and Stock Management |
|
❌ |
Google Shopping CPC Optimization |