At Market Overview, you can take a quick understanding about how is your price performance against your competitors' prices today.
Where to find it
Go to the new Market Overview section under Scraper section:

¶ Tracking summary
Show you information about the catalog we have in Optimus Price: number of products, brands and categories.

And the evolution of you percentile over the time.
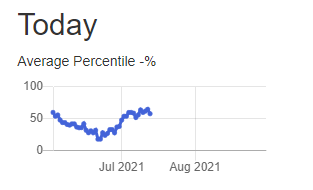
Percentile definition: in a range from 0 to 100, where 0 is the cheapest product and 100 the more expensive product, it shows how far are your price from that extremes prices.
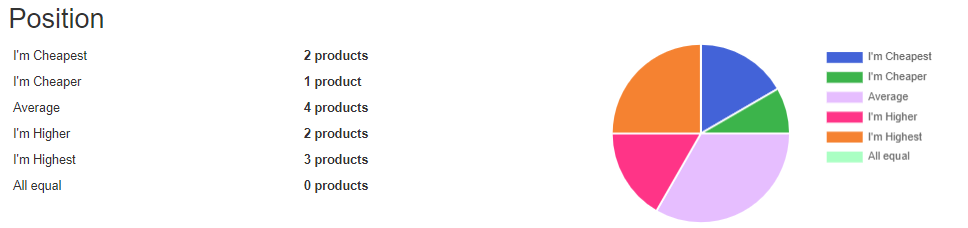
¶ Position
At the position, we show from your catalog, in how many products you are the cheapest, cheaper, average, higher, highest or equal. And we showed this information in two ways, in a table format and in a pie graph.
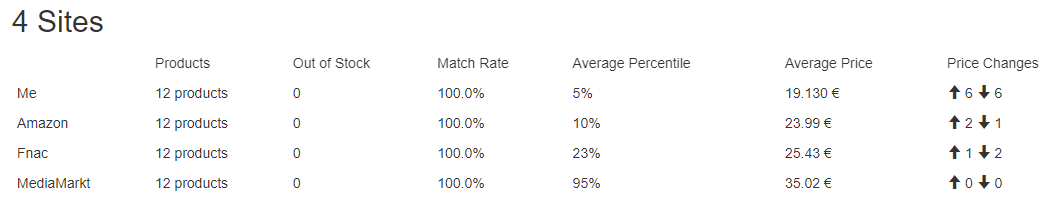
¶ Competitors overview
A table to compare you against the competitors in:
- Products: how many products they have from your catalogue
- Out of stock: number of product out of stock
- Match rate: how many products they have from your catalog in percentage
- Average percentile: we compare how more expensive or cheaper my product with their competitors from 0 to 100.
- Average prices: average price for each competitor
- Price change: number of product price that increase or decrease last week.
¶ Competitors overview
Compare your percentile against your direct competitors over the last days.

|
This feature is available for users of |
|
|
✅ |
Competitor Monitoring |
|
❌ |
AI Pricing |
|
❌ |
Sales Forecast and Stock Management |
|
❌ |
Google Shopping CPC Optimization |